AnyChart Stock and Financial Flash Chart 1.1.0
Free Trial Version
Publisher Description
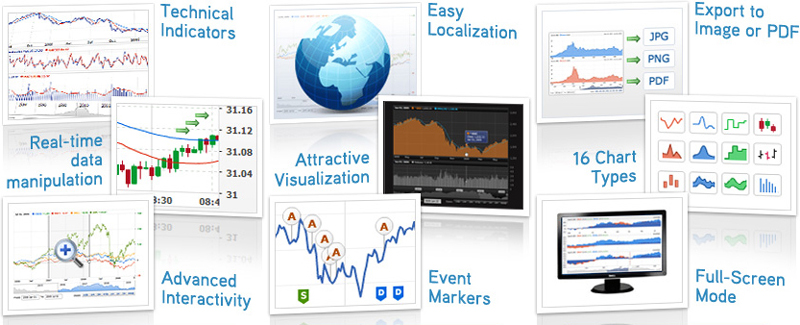
AnyChart Stock Component is a fully functional solution for solving the broadest range of data visualization problems. The component has numerous advantages over similar software, which excel it as a unique stock and financial charting solution on the market. While working on its functionality, we strove to make it comfortable and easy, so that you could work out the most sophisticated visualization tasks for large sets of financial data with little or no effort.
* Technical Indicators and Overlays - 12 fully customizable and automatically calculated technical indicators and overlays, which can be configured to suit your demands: Simple Moving Average, Exponential Moving Average, Bollinger Bands, Money Flow Index, MACD, Parabolic SAR, Rate of Change, Relative Strength Index, Stochastic Oscillator, Volume, Volume+MA, Williams %R
* Real-Time Data Streaming and Data Manipulations - a full feature set for creating real-time streaming and data manipulation applications. The Java Script library that comes with the component has methods that allow adding, updating, removing or inserting new data points or range of points.
* Advanced Interactivity, Rich Zooming, Scrolling and Navigation Options - all navigation elements meet all the industry's usability standards and are very comfortable in use.
* Drawing Tools for Technical Analysis -A complete list of drawing tools, giving end users an ability to add drawings to a chart such as Line segment, Ray, Trend line, Vertical Line, Horizontal Line, Rectangle, Ellipse, Triangle, Trend channel, Andrew's pitchfork, Fibonacci fan, Fibonacci arc, Fibonacci retracement, Fibonacci time-zones, Buy/Sell signals, Custom text labels and so on.
* Rich API, XML/JSON interface support
* Attractive and Flexible Visual Settings
* Export Chart as JPG, PNG or PDF
* Fourteen Chart Types, All Combinable
* Event Markers
* Advanced Date-Time Formatting
* Full Screen Mode
* and many other useful and exciting features.
About AnyChart Stock and Financial Flash Chart
AnyChart Stock and Financial Flash Chart is a free trial software published in the Flash Tools list of programs, part of Web Development.
This Flash Tools program is available in English. It was last updated on 22 April, 2024. AnyChart Stock and Financial Flash Chart is compatible with the following operating systems: Linux, Mac, Other, Unix, Windows, Windows-mobile.
The company that develops AnyChart Stock and Financial Flash Chart is AnyChart.Com. The latest version released by its developer is 1.1.0. This version was rated by 12 users of our site and has an average rating of 2.4.
The download we have available for AnyChart Stock and Financial Flash Chart has a file size of 1.05 MB. Just click the green Download button above to start the downloading process. The program is listed on our website since 2011-05-01 and was downloaded 542 times. We have already checked if the download link is safe, however for your own protection we recommend that you scan the downloaded software with your antivirus. Your antivirus may detect the AnyChart Stock and Financial Flash Chart as malware if the download link is broken.
How to install AnyChart Stock and Financial Flash Chart on your Windows device:
- Click on the Download button on our website. This will start the download from the website of the developer.
- Once the AnyChart Stock and Financial Flash Chart is downloaded click on it to start the setup process (assuming you are on a desktop computer).
- When the installation is finished you should be able to see and run the program.
